
Bubble diagramsare dynamic tools that breathe life into the realm of planning and design. They serve as visual maps, harnessing the power of simplicity to convey complex ideas in a single glance. These diagrams are not just clusters of circles; they represent the foundational blueprint in architecture, urban planning, interior design, and various creative domains. Their significance lies in their ability to distill intricate concepts into a visual language that resonates universally.
In this insightful guide, embark on a journey into the world of bubble diagrams. Discover their pivotal role in the initial phases of project planning and design ideation. Unravel the secrets of crafting visually compelling diagrams that encapsulate spatial relationships, hierarchies, and conceptual frameworks.
The Basics Of Bubble Diagrams
Here's an explanation of the basics of bubble diagrams, covering their purpose, elements, and applications
Purpose
- Visualizing Relationships and Organization -Bubble diagrams excel at graphically representing relationships and hierarchies between entities or concepts. They help you organize information and ideas in a clear, easy-to-understand manner.
- Early-Stage Exploration and Brainstorming -They're often used in the early stages of design, planning, or problem-solving to explore different arrangements and possibilities before committing to more detailed representations.
Basic Elements
- Bubbles -The core elements of bubble diagrams, representing different entities or concepts. Their size can sometimes reflect relative importance or complexity.
- Lines or Arrows -Used to show connections, relationships, or flow between bubbles. Lines can be solid, dashed, or arrows to indicate different types of relationships.
- Labels -Brief text descriptions within or near bubbles to clarify their meaning.
General Applications
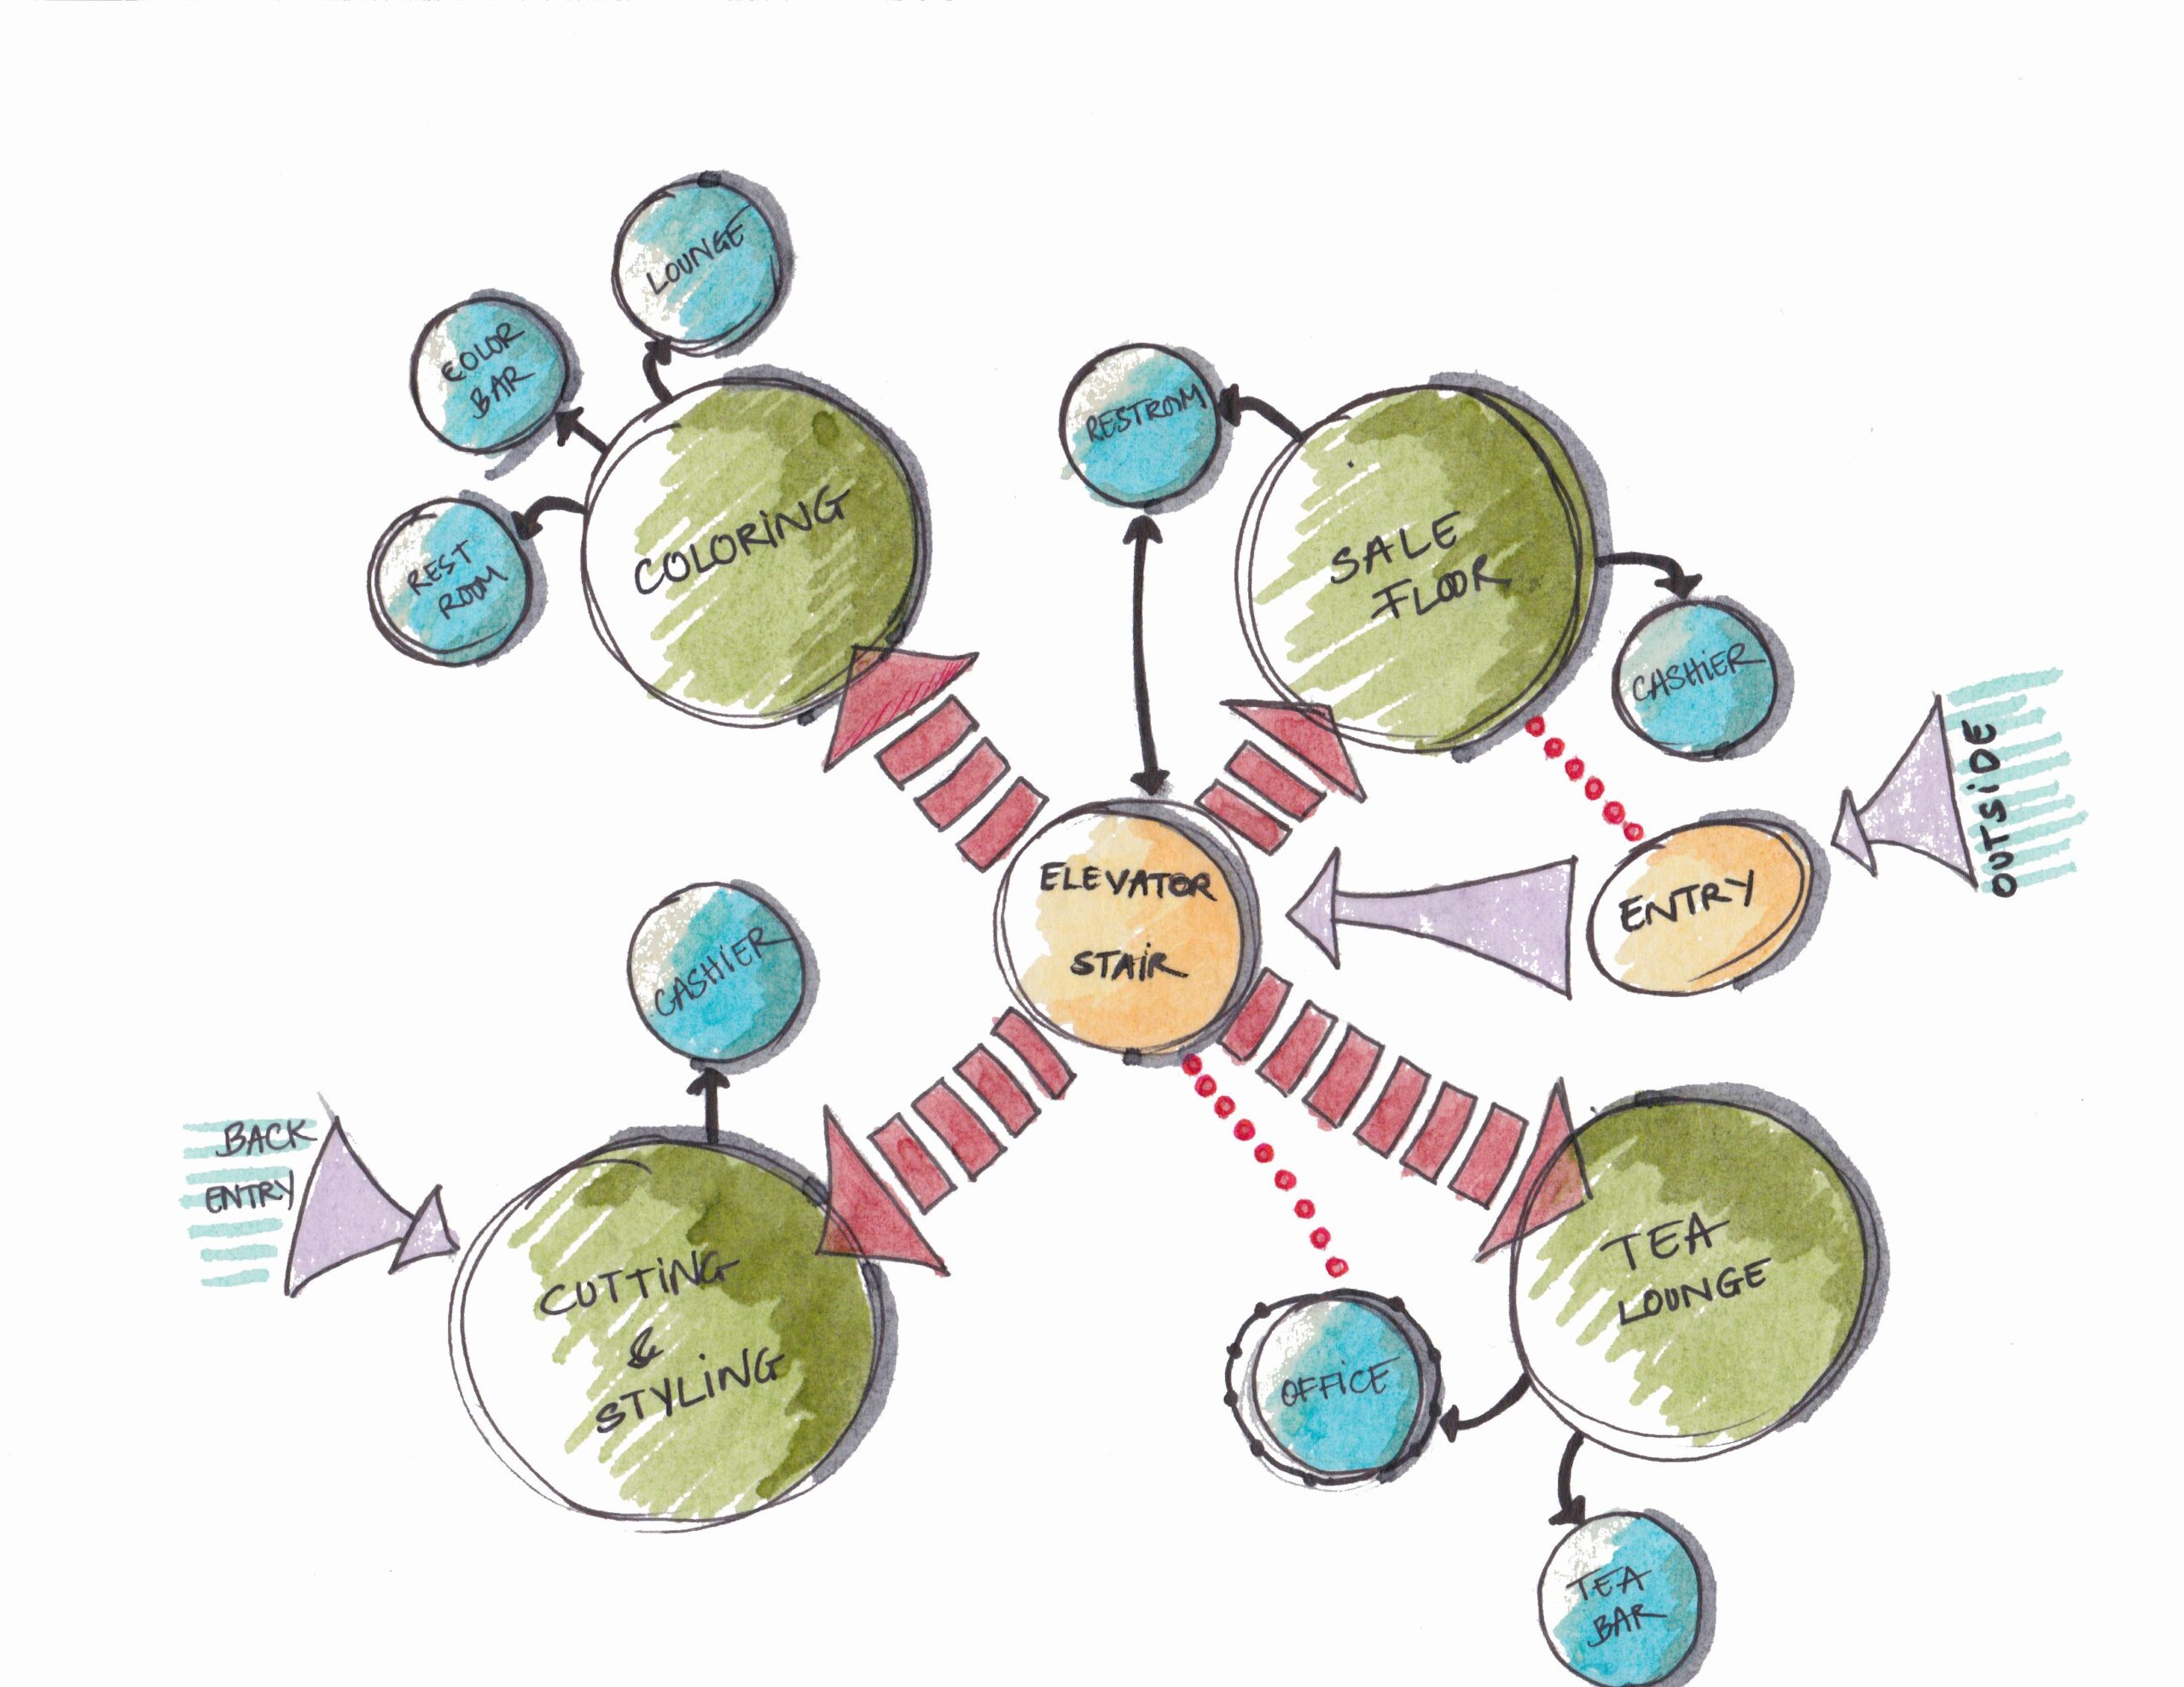
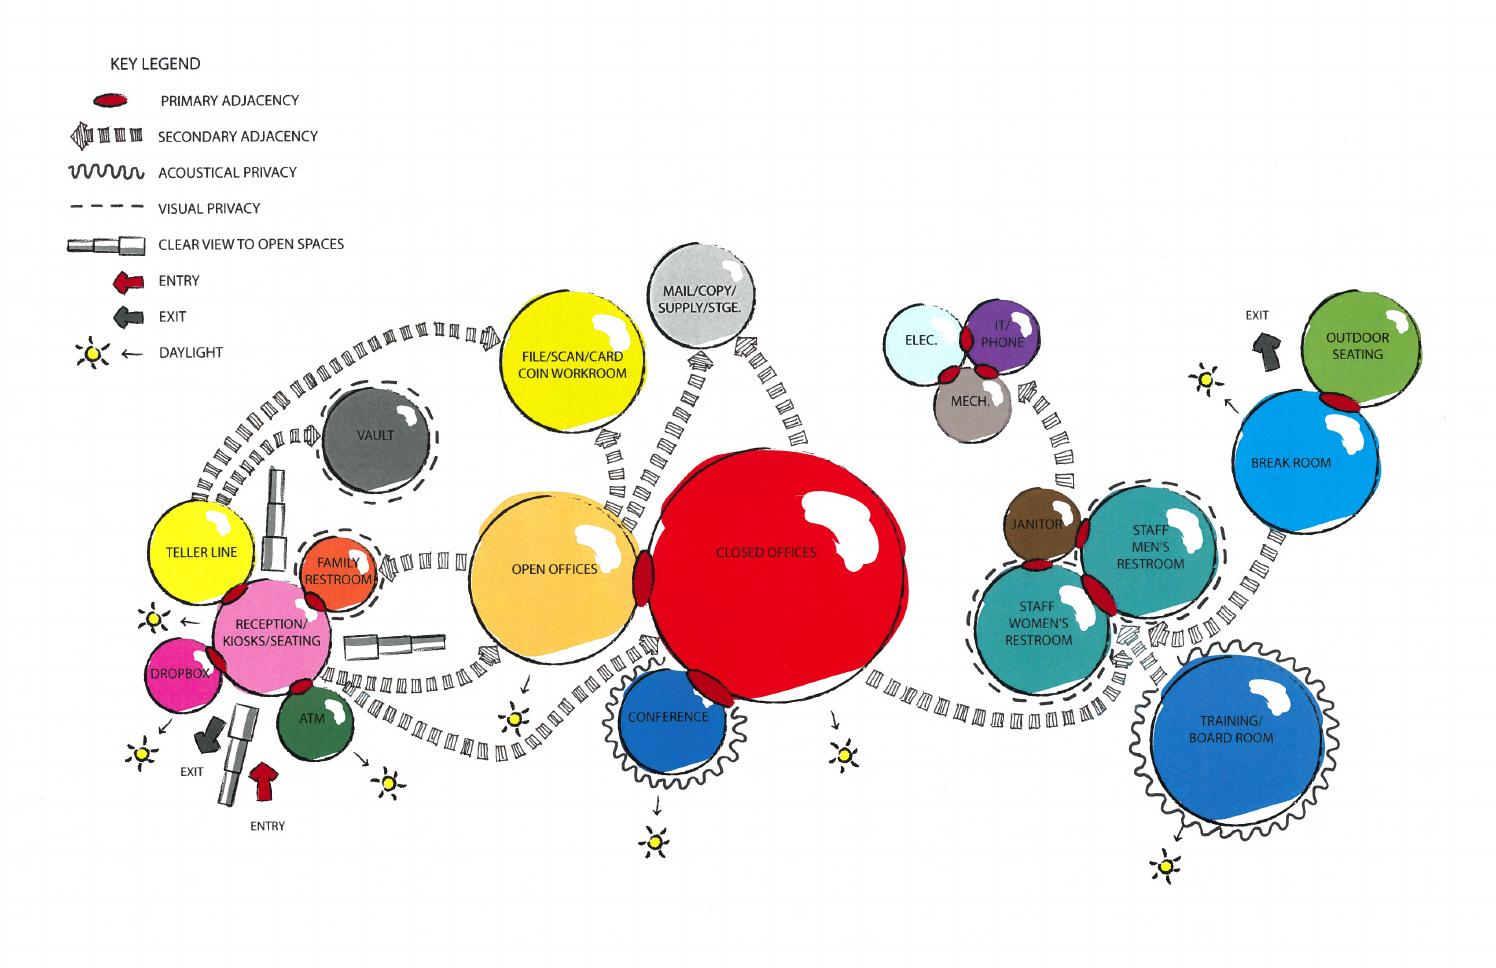
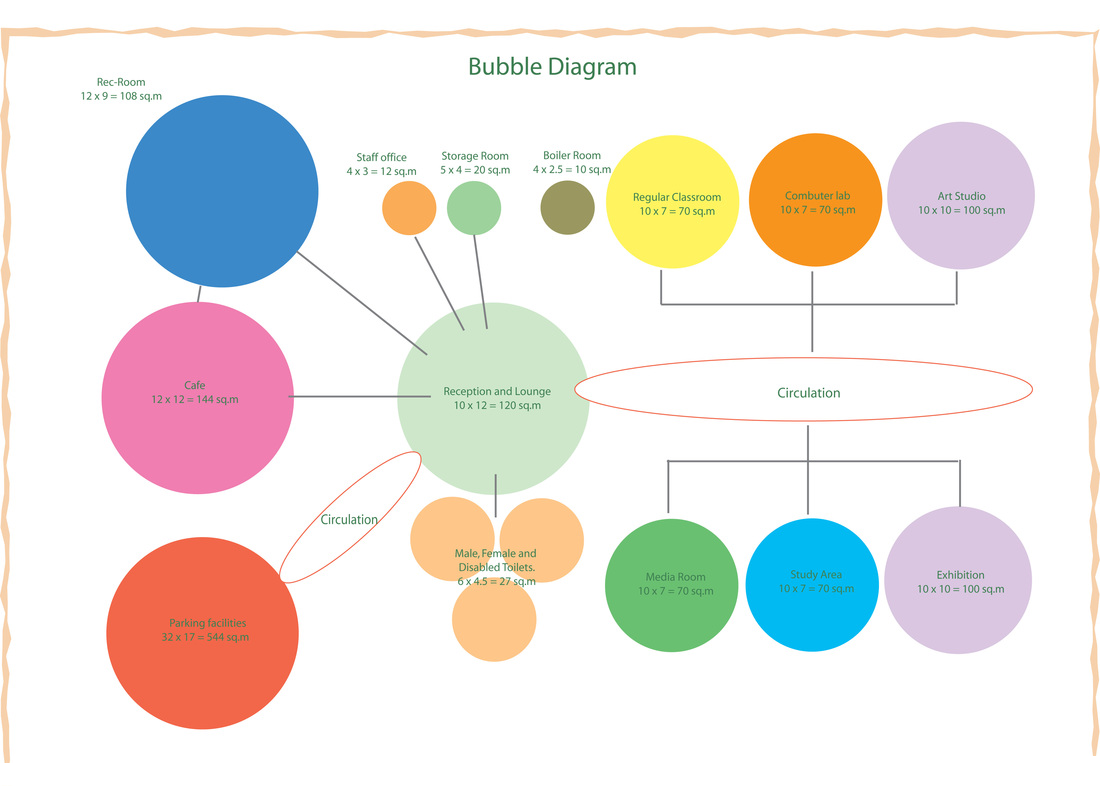
- Architecture and Interior Design- Spatial planning and functional relationships between rooms or areas. Exploring circulation patterns and user flows.
- Software and Systems Design - Mapping user interfaces and navigation flows. Representing data structures or relationships between components.
- Information Architecture - Organizing website content or knowledge bases.
- Project Management - Visualizing task dependencies and timelines.
- Education - Teaching concepts and relationships in various subjects, such as science, language, or social studies.
- Brainstorming and Mind Mapping - Generating and organizing ideas visually.
Key Points
- Bubble diagrams are versatile tools adaptable to various fields and problem-solving contexts.
- Their simplicity makes them accessible for users of all levels.
- They're excellent for quick iterations and exploring different arrangements easily.
Step-by-Step Guide To Drawing A Bubble Diagram
Here's a step-by-step guide to drawing bubble diagrams manually
1. Gather Your Materials
- Paper (blank or gridded)
- Pencil or pen
- Eraser
- Ruler or straight edge (optional)
- Markers or colored pencils (optional)
2. Define Your Purpose
- Clearly articulate what you want to visualize or organize with the diagram.
- This focus will guide your choices throughout the process.
3. List Key Entities Or Concepts
- Write down the primary elements you want to include in the diagram.
- Consider their relative importance and potential relationships.
4. Start Sketching Bubbles
- Draw circles or ovals representing each entity or concept.
- Vary bubble sizes to reflect importance or complexity, if relevant.
- Tip -Use light pencil strokes initially for easy adjustments.
5. Arrange Bubbles
- Position bubbles on the paper to show relationships or hierarchies.
- Consider spatial proximity, grouping, or overlapping for visual cues.
- Tip -Keep in mind visual balance and clarity.
6. Connect Bubbles
- Draw lines or arrows to link related bubbles.
- Use solid lines for direct connections, dashed lines for weaker relationships, or arrows to indicate flow.
- Tip - Annotate lines for further clarity, if needed.
7. Add Labels
- Write brief text descriptions inside or near bubbles to clarify their meaning.
- Use clear and concise language.
8. Refine And Iterate
- Step back and evaluate the diagram's visual clarity and effectiveness.
- Adjust bubble sizes, positions, or connections as needed.
- Add or remove elements as required.
Additional Tips
- Use colors or patterns to visually differentiate bubble groups or categories, optional.
- Consider using a ruler for straighter lines, if desired.
- Experiment with different layouts and bubble arrangements.
- Don't be afraid to erase and redraw as you fine-tune the diagram.
- Incorporate visual hierarchy by varying bubble sizes and line weights.
- Use color strategically, but avoid overwhelming the diagram.
- Step back and review the diagram for clarity and readability.
Remember -Bubble diagrams are intended to be flexible and evolve as your ideas develop. Embrace iteration and experimentation to create a diagram that effectively communicates your intended relationships and concepts.
Using Software Tools For Bubble Diagrams
While manual drawing is often a good starting point, several software tools can enhance the creation and refinement of bubble diagrams.
Here's a overview of popular software options
1. Diagramming Software
- Microsoft Visio -Versatile tool with a wide range of shapes and templates, including bubble diagrams.
- Lucidchart -Cloud-based tool known for its ease of use, real-time collaboration, and integration with other platforms.
- Creately -Offers a user-friendly interface, templates, and features for brainstorming and mind mapping.
- SmartDraw -Provides a range of templates and tools for professional-looking bubble diagrams.
- Diagrams.net -Free, open-source option with a straightforward interface and basic diagramming features.
2. Mind Mapping Software
- XMind -Popular mind mapping tool with bubble-like diagram layouts and visual customization options.
- MindMeister -Cloud-based tool with collaboration features and visual appeal.
- Coggle -Simple, web-based tool for creating structured bubble diagrams with easy sharing.
3. Design Software
- Adobe Illustrator -Vector graphics software with flexibility for bubble diagrams, but requires design experience.
- SketchUp -3D modeling software that also supports 2D bubble diagrams.
4. General Productivity Tools
- Microsoft PowerPoint -Simple bubble diagrams can be created using shapes and connectors.
- Google Slides -Similar functionality for basic bubble diagrams within presentations.
Key Features To Consider
- Ease of Use - Intuitive interface, drag-and-drop functionality, and clear editing tools.
- Template Library -Pre-built bubble diagram templates to save time and provide a kickstart.
- Shape and Line Customization -Ability to modify bubble shapes, colors, line styles, and add text labels.
- Formatting Options -Control over font styles, colors, and layout for visual appeal.
- Collaboration Features -Real-time editing and commenting for teamwork.
- Export Formats -Output options in common image or document formats for sharing and presentations.
Choosing the right software depends on your specific needs, familiarity with different tools, and budget considerations.
Tips For Effective Bubble Diagrams
Here are tips for crafting effective bubble diagrams that clearly communicate relationships and ideas
Clarity And Readability
- Keep it Simple -Start with a clear purpose and focus on essential elements. Avoid overcrowding the diagram.
- Use Clear Labels -Employ concise, descriptive language within or near bubbles.
- Visual Hierarchy -Vary bubble sizes, line weights, and colors strategically to highlight important elements and relationships.
- Distinctive Shapes -Consider using shapes other than circles (e.g., rectangles, triangles) for visual differentiation, if appropriate.
- Whitespace -Leave ample space between bubbles and lines for visual clarity and breathing room.
- Consistent Formatting -Maintain consistent font styles, line types, and colors throughout the diagram.
Organization And Structure
- Group Related Bubbles -Gather related concepts or entities visually for better comprehension.
- Spatial Arrangement -Position bubbles meaningfully to reflect relationships or hierarchies.
- Flow and Direction -Use arrows or directional lines to guide the eye and indicate relationships or processes.
- Grids or Boundaries -Consider using an underlying grid or boundaries for structure in complex diagrams.
Iteration And Feedback
- Refine as You Go -Bubble diagrams are adaptable; adjust as needed to reflect evolving ideas or feedback.
- Gather Feedback -Seek input from others to ensure clarity and effectiveness.
Additional Tips
- Color Considerations -Use color thoughtfully to enhance visual cues and organization, but avoid overwhelming the diagram.
- Legends -For complex diagrams, create a legend to explain symbols or color-coding.
- Context -Provide a brief overview of the diagram's purpose or context to aid understanding.
Common Mistakes To Avoid In Bubble Diagrams
Here are some common mistakes to avoid when creating bubble diagrams, along with tips for dodging them
Confusion Over Size And Area
Mistake -Scaling bubble radius instead of area to represent data values. This distorts comparisons, as a slight increase in radius translates to a much larger area increase.
Tip -Use dedicated drawing tools or software that automatically scales area, or manually calculate and adjust areas when drawing by hand.
Overcrowding And Clutter
Mistake -Cramming too many bubbles into a limited space, leading to visual chaos and difficulty in deciphering relationships.
Tip -Prioritize essential elements, consider zooming in on specific sections, or create multiple diagrams for complex situations.
Misleading Relationships
Mistake -Using ambiguous line connections or proximity alone to imply relationships without clear labels or explanation.
Tip -Employ distinct line styles and arrows for different types of relationships, and consistently label connections for precise meaning.
Inconsistent Visual Hierarchy
Mistake -Overusing similar bubble sizes, colors, and line weights, making it difficult to differentiate importance or connections.
Tip -Apply strategic variation in size, color, and line thickness to highlight key elements and relationships, guiding the viewer's attention.
Neglecting Visual Clarity
Mistake -Using small fonts, intricate details, or insufficient contrast between elements, hindering readability and accessibility.
Tip -Prioritize simplicity, ensure adequate font size and spacing, and maintain clear differentiation between bubbles, lines, and text.
Ignoring Color Accessibility
Mistake -Employing color combinations with poor contrast or relying solely on color to convey information, potentially excluding viewers with visual impairments.
Tip -Choose accessible color palettes with sufficient contrast, and consider supplementing color with additional visual cues like texture or patterns.
Missing Context And Labels
Mistake -Assuming viewers automatically understand the diagram's purpose and meaning without context or clear labels.
Tip -Provide a brief title or description explaining the diagram's focus, and ensure consistent and concise labels within or near bubbles.
By avoiding these common pitfalls and embracing the tips provided, you can create insightful and impactful bubble diagrams that effectively communicate your ideas and relationships. Remember, clarity, organization, and consistent visual language are key to crafting successful bubble diagrams.
Advanced Techniques In Bubble Diagram Creation
For those who've mastered the basics, let's dive into captivating ways to elevate your bubble diagrams:
1. Beyond Circles
- Shapes for Meaning -Experiment with squares, triangles, hexagons, or custom shapes to visually represent category or type.
- Morphing Bubbles -Use gradient fills or blended shapes to showcase evolution or transitions within elements.
- Textured Surfaces -Apply subtle textures to specific bubbles for visual hierarchy or to suggest data attributes.
2. Layering And Dimensionality
- Multi-layered Diagrams -Create overlays to show different information layers or progressive development stages.
- 3D Effects -Use perspective, shadows, and subtle gradients to add depth and dimensionality (consider specialized software).
- Interactive Diagrams -Explore online tools or coding libraries to enable zooming, animation, or data-driven interactions.
3. Data Visualization Enhancements
- Heatmaps -Use color gradients within bubbles to represent data values, such as temperature or performance metrics.
- Proportional Symbol Sizes -Scale bubble area precisely to reflect data values, ensuring accurate comparisons.
- Linked Charts -Integrate bar charts, line graphs, or pie charts within larger bubbles for deeper data exploration.
4. Narrative And Storytelling
- Character Design -Assign personalities or visual metaphors to bubbles to engage viewers and create a narrative.
- Connective Elements -Use pathways, arrows with varying opacity, or background imagery to depict flow or movement.
- Unexpected Juxtapositions -Place opposing or contrasting elements near each other to spark curiosity and discussion.
5. Beyond The Static Image
- Animated Explainer Videos -Use animated bubble diagrams to tell a story with visual progression and narration.
- Real-time Data Dashboards -Integrate bubble diagrams with live data feeds to visualize dynamic processes.
- Interactive Infographics -Combine bubble diagrams with other elements to create engaging, data-driven storytelling experiences.
When embracing advanced techniques, prioritize clarity and purpose. Don't overwhelm viewers with visual complexity or lose sight of the core message you want to convey.