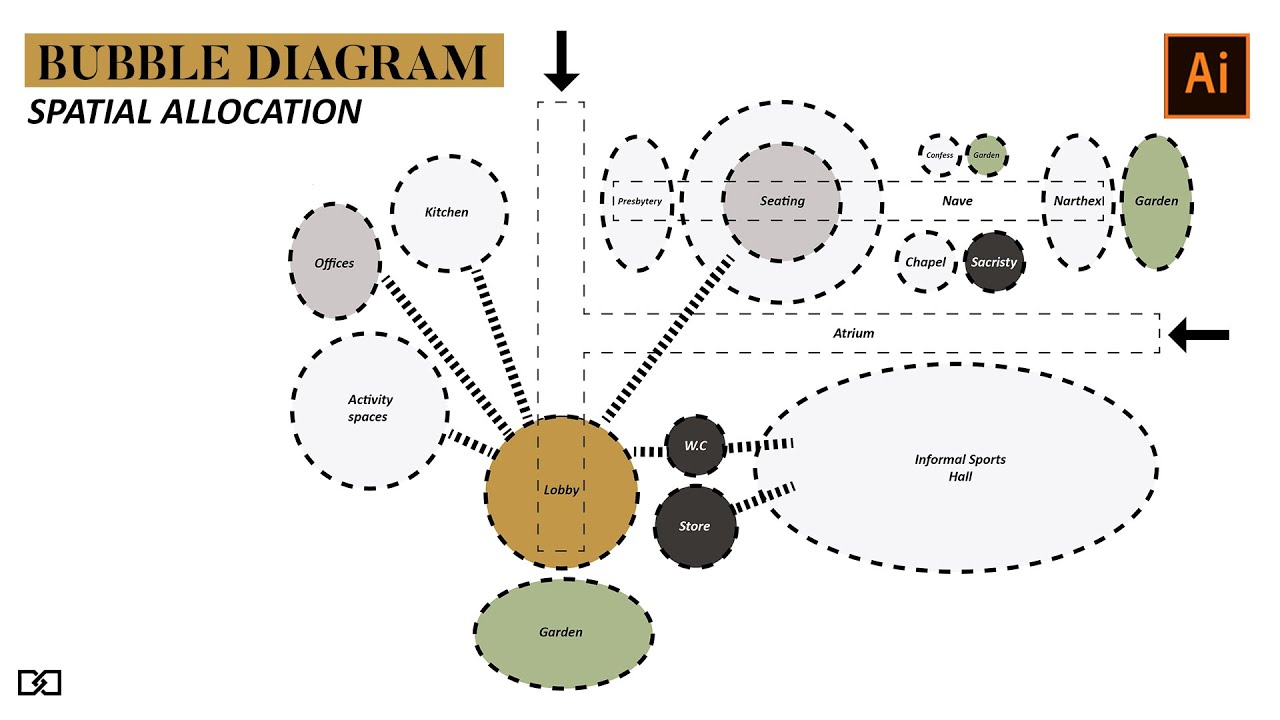
Bubble diagram in architecture, serve as fundamental tools in architectural design, providing a visual representation of spatial relationships within a given space. Essentially, they are schematic diagrams that help architects and designers conceptualize and organize various functions and zones within a building or site. These diagrams employ simple bubble-like shapes to represent different areas or activities, showcasing how they interrelate and interact.
At its core, the primary purpose of a bubble diagram is to outline the flow, connectivity, and hierarchy of spaces, emphasizing the functional relationships rather than specific structural details. These diagrams act as a starting point in the design process, allowing architects to explore and experiment with different spatial arrangements before diving into more detailed plans.
The Role Of Bubble Diagrams In Architectural Planning
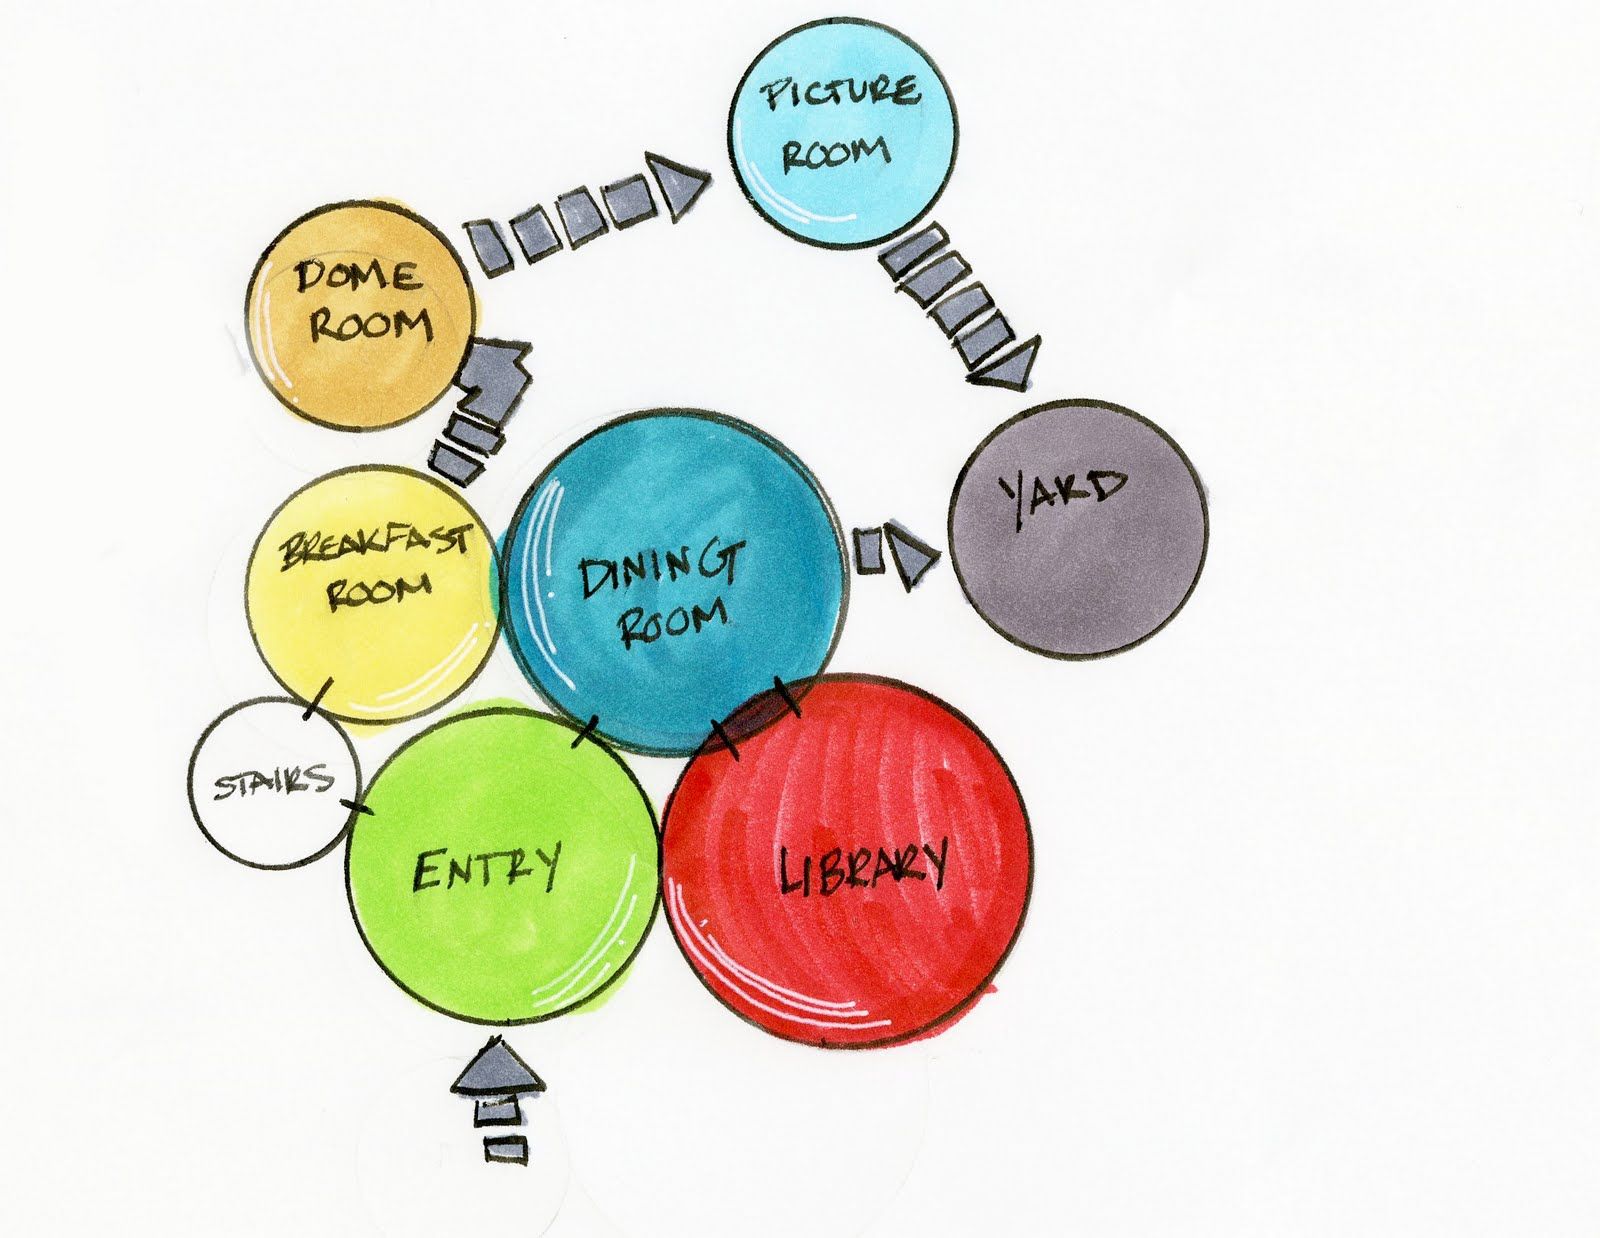
In the early stages of architectural design, bubble diagramsact as flexible thought bubbles, helping organize space and form. They're:
Quick and fluid -Rough circles represent spaces, connected by lines indicating relationships (close, distant, visual connection). This allows for rapid exploration ofmultiple layouts without getting bogged down in details.
Spatial organization -By resizing and positioning bubbles, architects juggle spaceallocation and proximity needs, giving a feel for flow and overall massing.
Conceptual development -Bubble diagrams are visual playgrounds for testing ideas about connections, hierarchies, and circulation. They spark intuitive responses to the program and site, informing the overall concept.
Think of them as sketchy blueprints, fostering creativity and efficient space planning at the initial stages of architectural design.
Creating A Bubble Diagram - Key Elements And Process
1. Gather Requirements
- List the essential spaces (rooms, areas) and their functions.
- Consider their sizes and relationships (close, distant, visual connections).
- Identify circulation paths (how people will move through the spaces).
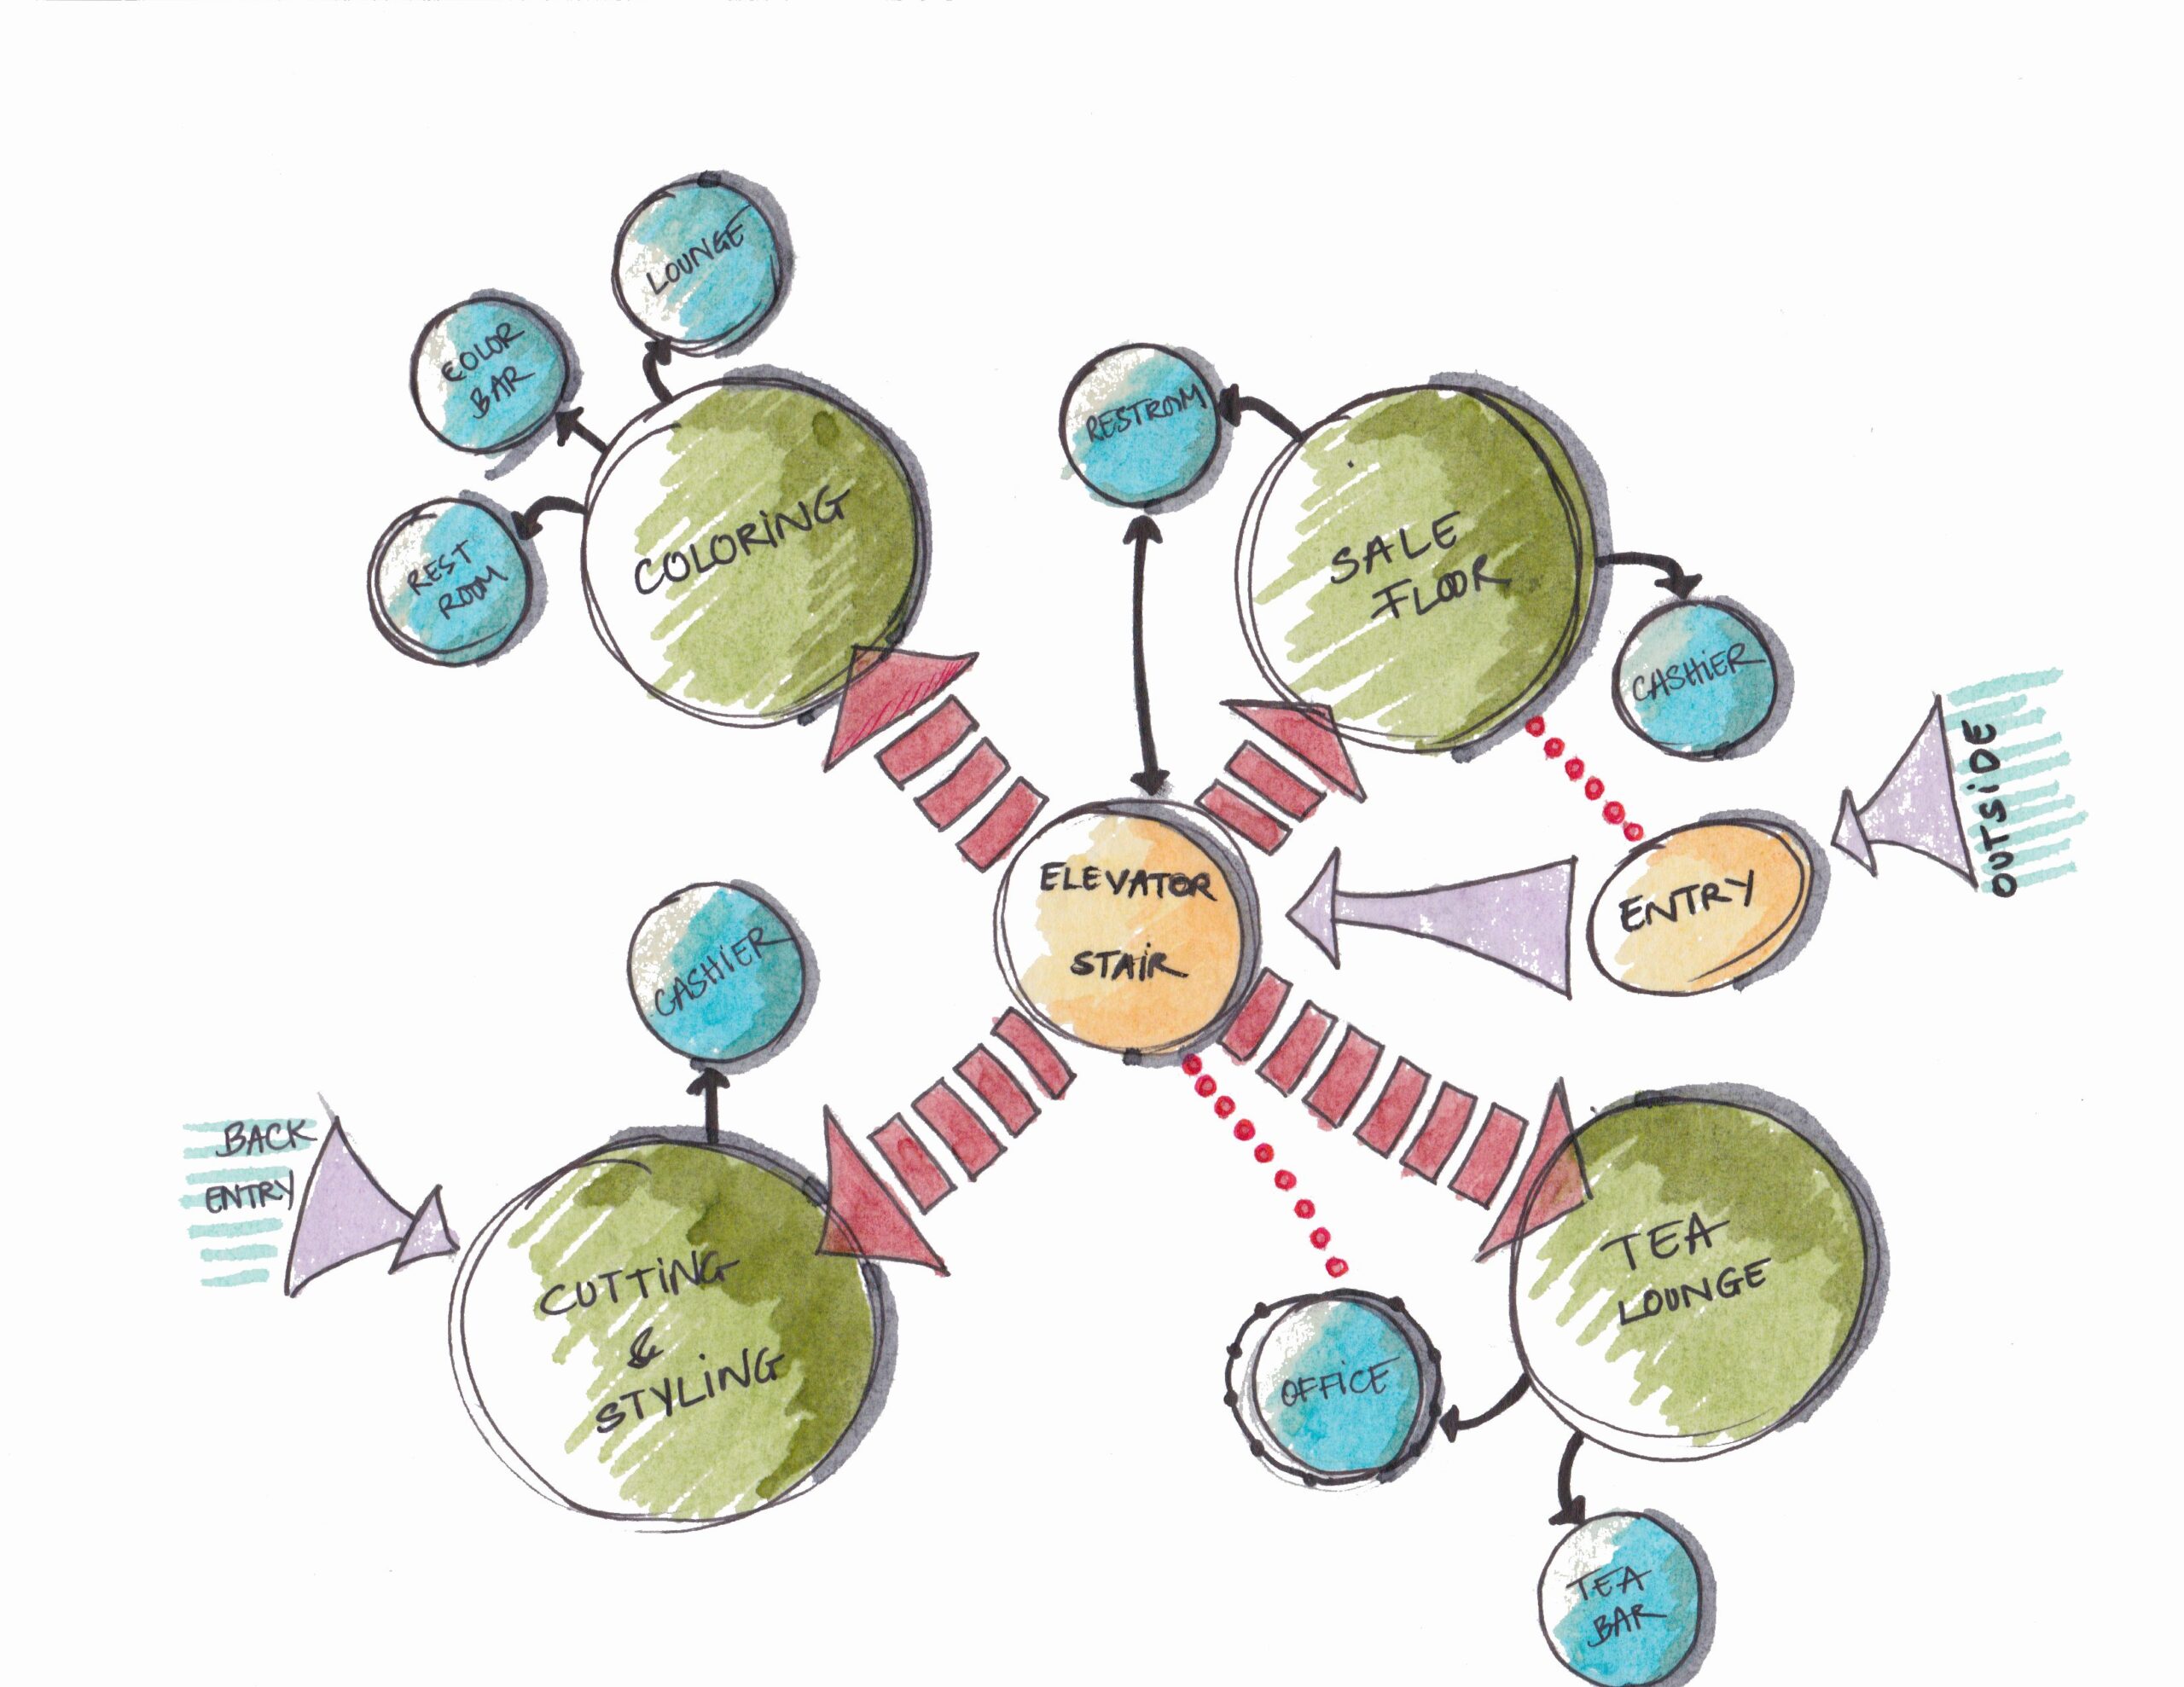
2. Sketch Bubbles
- Draw rough circles (bubbles) for each space.
- Label each bubble with its function.
- Vary bubble sizes to hint at relative space proportions.
3. Connect And Organize
- Use lines to connect bubbles, indicating relationships:
- Group related bubbles together.
- Experiment with different arrangements to explore spatial concepts.
4. Refine And Iterate
- Adjust bubble sizes and positions as needed.
- Rethink relationships and circulation patterns.
- Create multiple diagrams to explore different ideas.
5. Overlay Site (Optional)
- If a site plan is available, lightly sketch it behind the bubbles for context.
- Consider how the diagram responds to site features and constraints.
Remember -Bubble diagrams are meant to be fluid and adaptable. Focus on capturing the essence of spatial relationships and functions, not on perfect drawings.
Key Elements
- Bubbles (representing spaces)
- Lines (representing relationships)
- Labels (indicating functions)
- Size variations (suggesting relative space proportions)
- Circulation paths (arrows)
- Optional site overlay
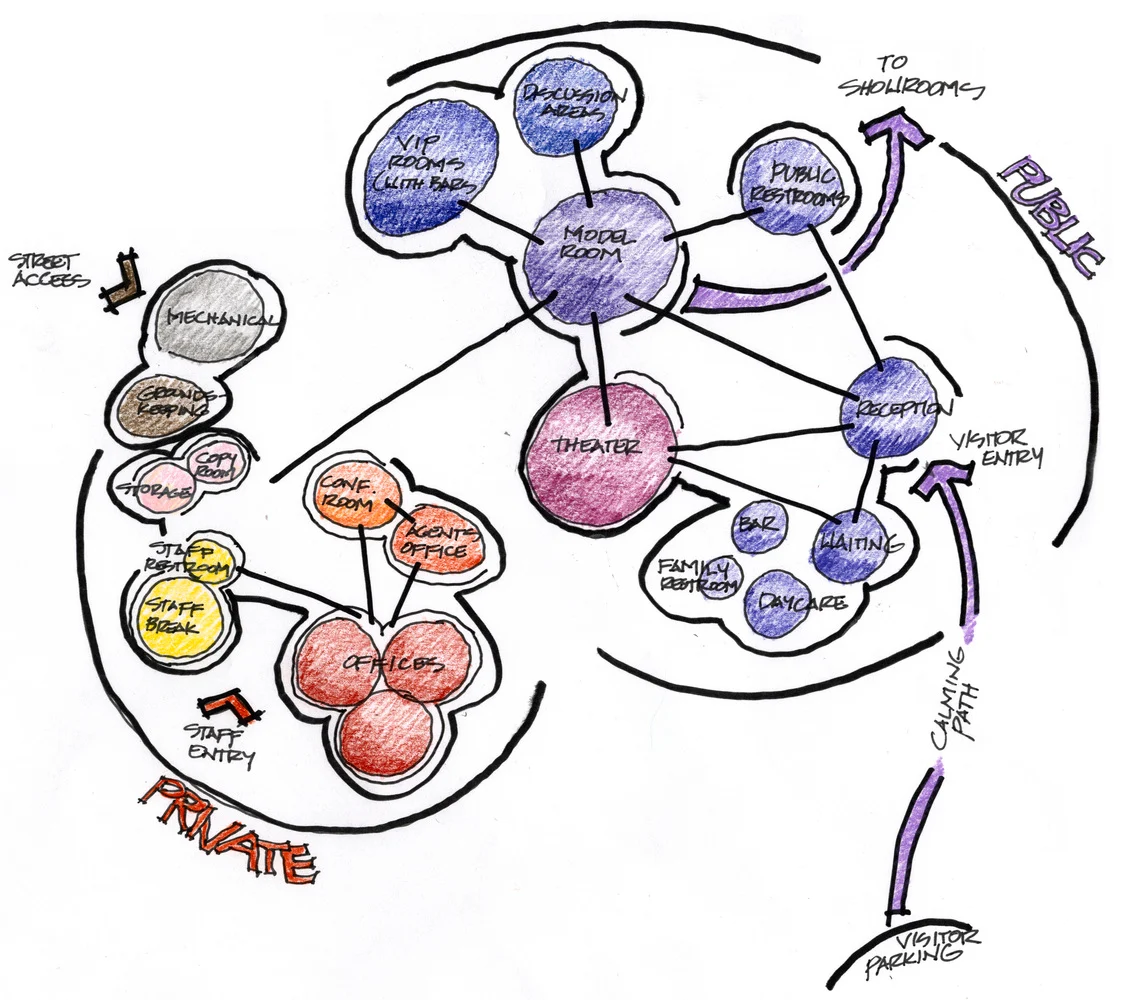
Effective Use Of Bubble Diagrams In Architecture
Real-world examples of bubble diagrams in action:
1. Sydney Opera House
Jørn Utzon famously used bubble diagrams to explore the iconic shell structures. By adjusting the size and positioning of the "bubbles," he optimized stage configurations, audience relationships, and visual connections to the harbor. This iterative process led to the unique and functional form of the Opera House.
2. Pompidou Centre, Paris
Renzo Piano and Richard Rogers employed bubble diagrams to organize the museum's diverse program. They separated functional areas – exhibition spaces, education, circulation, etc. – into distinct bubbles, connected by flexible bridges. This diagrammatic approach allowed for future reconfiguration and adaptable use of the space.
3. Googleplex, California
The sprawling Google headquarters benefited from bubble diagrams in its master plan. By arranging building clusters as distinct bubbles around a central park, the architects fostered collaboration and outdoor interaction while maintaining distinct departmental identities. This diagrammatic organization guided the project's development and contributed to its vibrant campus atmosphere.
4. Tianjin Eco-City, China
In this sustainable urban development, bubble diagrams helped integrate ecological principles into the design. By clustering buildings based on functions and resource needs, the architects optimized solar access, minimized energy consumption, and created efficient pedestrian flow. The diagrams informed the placement of green spaces and facilitated the development of a holistic and interconnected city plan.
These examples showcase how bubble diagrams, beyond mere space planning, can:
- Spark creative form-finding -The fluidity of bubbles allows for exploration of unconventional shapes and spatial relationships.
- Facilitate communication -Visually representing the program makes it easier for architects, clients, and stakeholders to understand the design intent.
- Promote adaptation and flexibility -Bubble diagrams are easily modified, allowing for adjustments throughout the design process and beyond.
Comparing Bubble Diagrams With Other Architectural Tools
While all have their place in the architect's arsenal, bubble diagrams, floor plans, and 3D models each offer unique perspectives on a design. Let's explore their differences:
Bubble Diagrams
Unique Benefits
- Exploratory and fluid -Ideal for initial brainstorming, allowing rapid iteration of spatial relationships and formfinding.
- Focus on function and connection -Emphasizes program needs and proximity, enabling clear understanding of how spaces interact.
- Abstract and flexible -Not bound by scale or details, fostering creative thinking without technical constraints.
Limitations
- Lack of detail -Provides limited information about dimensions, construction, or specific features.
- Ambiguity can lead to misinterpretation -Requires translation into more precise documentation like floor plans.
- Not suitable for presentation -Primarily a tool for internal design development, not for communicating final design to clients.
Floor Plans
Unique Benefits
- Precise and scaled -Accurately represent dimensions, proportions, and relationships between spaces.
- Communicate details -Include wall thicknesses, door locations, windows, and furniture layouts.
- Formal representation -Serve as a clear and detailed document for construction and permitting.
Limitations
- Static and inflexible -Difficult to modify once finalized, limiting opportunities for exploration and iteration.
- Focus on layout -Less emphasis on functional relationships and conceptual ideas compared to bubble diagrams.
- Limited visual understanding -Can be challenging to visualize 3D relationships from a 2D plan.
3D Models
Unique Benefits
- Realistic visualization -Provide immersive understanding of form, space, and materiality.
- Client engagement -Powerful tool for communicating design intent and facilitating feedback.
- Technical analysis -Useful for testing sunlight, shadows, and building performance simulations.
Limitations
- Time-consuming -Requires significant effort to create and modify complex models.
- Potential for misinterpretation -Emphasis on visuals can overshadow functional or programmatic considerations.
- Technical expertise required -Not all stakeholders can easily interpret or manipulate 3D models.
The key is to utilize these tools in harmony
- Start with bubble diagrams for brainstorming and initial space planning.
- Refine with floor plans to establish precise dimensions and details.
- Enhance with 3D models for realistic visualization and client engagement.
The Evolution Of Bubble Diagrams In Architectural Design
The humble bubble diagram, a seemingly simple tool of circles and lines, boasts a surprisingly rich history intertwined with the evolution ofarchitectural designitself. Let's take a whirlwind trip through its fascinating journey:
Early Traces (18th - 19th Centuries)
Hints of early bubble-like concepts can be found in 18th-century French natural history diagrams, where circles represented interconnected species.
Robert Kerr proposed a "thoroughfare plan" in 1864, emphasizing spatial organization and movement within buildings.
Emergence And Refinement (Early 20th Century)
Le Corbusier, in his 1927 article "Towards New Architectures," popularized the use of "esquisse" diagrams, essentially early bubble diagrams for initial design exploration.
Harbeson's Beaux-Arts student manual (1926) further described similar methods for organizing spaces based on program requirements.
Modernization And Proliferation (Mid-20th Century)
The term "bubble diagram" likely emerged in the 1960s, coinciding with the rise of systematic design methods and space planning theories.
Architects like Kevin Roche and John Dinkeloo championed their use for major projects, including the Ford Foundation headquarters.
The influence of set theory and symbolic logic added a layer of rigor and structure to the methodology.
Digital Transformation And Beyond (Late 20th Century - Present)
Computer-aided design (CAD) software revolutionized bubble diagramming, allowing for rapid iteration, digital overlays with site plans, and 3D model integration.
Focus on sustainability and environmental responsiveness led to incorporating ecological considerations into bubble diagrams, like solar access and energy flow.
Contemporary architects like Frank Gehry and Zaha Hadid continue to use and adapt bubble diagrams in their highly complex and fluid designs.
Significant Advancements
- Increased flexibility and interactivity -Digital tools enable real-time adjustments, fostering dynamic exploration and collaboration.
- Hybrid approaches -Combining bubble diagrams with other tools like 3D modeling and virtual reality creates a more holistic design process.
- Focus on user experience -Bubble diagrams are increasingly used to analyze circulation patterns, accessibility, and human interaction within spaces.
Looking Ahead, The Future Of Bubble Diagrams Seems Bright
Continued integration with advanced technologies like artificial intelligence and augmented reality holds potential for even more intuitive and efficient design exploration.
As sustainability becomes paramount, bubble diagrams can play a crucial role in optimizing energy efficiency, material usage, and site integration.
Digital Tools And Software For Creating Bubble Diagrams
Gone are the days of meticulously sketching circles and lines on paper. The digital age has blessed us with a plethora of tools to craft your architectural ideas into vibrant bubble diagrams. Let's delve into some popular options:
1. Diagramming Software
Miro -A whiteboard-style tool that encourages visual thinking and playful ideation. Offers diverse templates, sticky notes, and freehand drawing capabilities, making it ideal for dynamic brainstorming sessions.
Lucidchart -A collaborative online platform, perfect for brainstorming with teammates in real-time. Features intuitive drag-and-drop functionality, extensive symbol libraries, and integrations with cloud storage services.
Microsoft Visio -A classic go-to, offering pre-made templates and shapes specifically for bubble diagrams. Easy to use and integrates seamlessly with other Microsoft Office products.
2. Architecture-Specific Software
FreeCAD -An open-source, parametric modeling software offering surprising versatility for bubble diagramming. Create 2D shapes, adjust sizes and relationships, and even export your diagram as an image file or 3D model for further development.
ArchiCAD -A professional-grade BIM (Building Information Modeling) software. While primarily for detailed architectural models, it also includes bubble diagramming tools with features like advanced connection settings and automatic area calculations.
SketchUp -A 3D modeling program with a simple learning curve. Includes plugins dedicated to bubble diagramming, allowing you to quickly generate basic shapes and connect them with lines.
3. Mobile Apps
- Bubble Diagram Pro -A dedicated app for iOS and Android, offering a user-friendly interface for quick and easy bubble diagramming on the go. Create, edit, and share your diagrams with ease, perfect for capturing fleeting ideas.
- Mindly -A mind mapping app that can be repurposed for bubble diagramming. Start with a central "bubble" (your project) and branch out with sub-bubbles representing different spaces or functions.
Choosing the right tool depends on your needs and preferences. Consider factors like:
- Complexity of your project -Simpler tools for basic diagrams, advanced software for complex designs.
- Collaboration requirements -Choose tools with real-time editing or cloud sharing features if working with a team.
- Budget -Free options are available, while professional software might require subscriptions.
The Future Of Bubble Diagrams In Architecture
Gazing into the crystal ball of architectural design, the future of bubble diagrams appears vibrant and brimming with potential. Buckle up, as we explore what lies ahead for these playful circles and connecting lines:
1. Enhanced Interactivity And Collaboration
- Imagine real-time virtual reality walkthroughs of your bubble diagram, adjusting spaces and relationships on the fly with colleagues across the globe.
- Advanced AI algorithms might suggest optimal layouts based on program, site constraints, and even user behavior patterns.
2. Seamless Integration With Advanced Technologies
- Bubble diagrams could directly feed into 3D modeling software, generating initial forms and massing studies with a click.
- Augmented reality overlays on real-world sites could help visualize how the design interacts with the existing environment.
3. Focus On Sustainability And Performance
- Bubble diagrams might incorporate real-time energy simulations, optimizing solar access, ventilation, and resource usage within the design.
- Building materials and their ecological impact could be directly linked to the bubbles, enabling informed material choices early on.
4. Democratization Of Design
- User-friendly interfaces and intuitive mobile apps could put the power of bubble diagramming in the hands of everyone, not just architects.
- Imagine communities and stakeholders participating in the initial design process through interactive bubble diagram workshops.
5. Blurring The Lines Between Physical And Digital
- Interactive digital models could morph into physical installations using shape-shifting materials, allowing for dynamic experimentation with bubble diagrams in the real world.
- Building information could be embedded within the bubbles themselves, accessible through augmented reality displays for maintenance and future modifications.
Technological advancements will undoubtedly play a crucial role in shaping the future of bubble diagrams:
- Artificial intelligence might analyze vast datasets of successful building designs, suggesting optimal spatial relationships and bubble configurations.
- Advanced fabrication techniques could bring even the most unconventional bubble diagram forms to life, pushing the boundaries of architectural expression.
Conclusion
In the realm of architectural design, bubble diagrams serve as indispensable tools, offering a holistic view of spatial relationships and functional connections within a built environment. Their importance lies in their ability to distill complex design concepts into simple, visually intuitive representations.
By allowing architects and designers to explore various spatial arrangements and test different scenarios at an early stage, these diagrams significantly contribute to the efficiency of the design process. They serve as a creative springboard, fostering brainstorming and ideation, enabling professionals to experiment with diverse layouts and configurations while considering the optimal flow and functionality of spaces.